![White logo TopLeft_240x78.png]](https://help.topleft.team/hs-fs/hubfs/White%20logo%20TopLeft_240x78.png?height=50&name=White%20logo%20TopLeft_240x78.png)
TopLeft shows your project tasks in Gantt charts so you can understand the timing of projects and tasks.
Gantt charts are available to all TopLeft users. Users with a Viewer license can view the chart but not drag task bars to change dates. Users with Engineer and Manager licenses can drag task bars to change dates.
Manage an Individual Project in Gantt
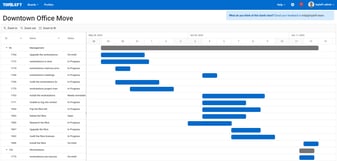
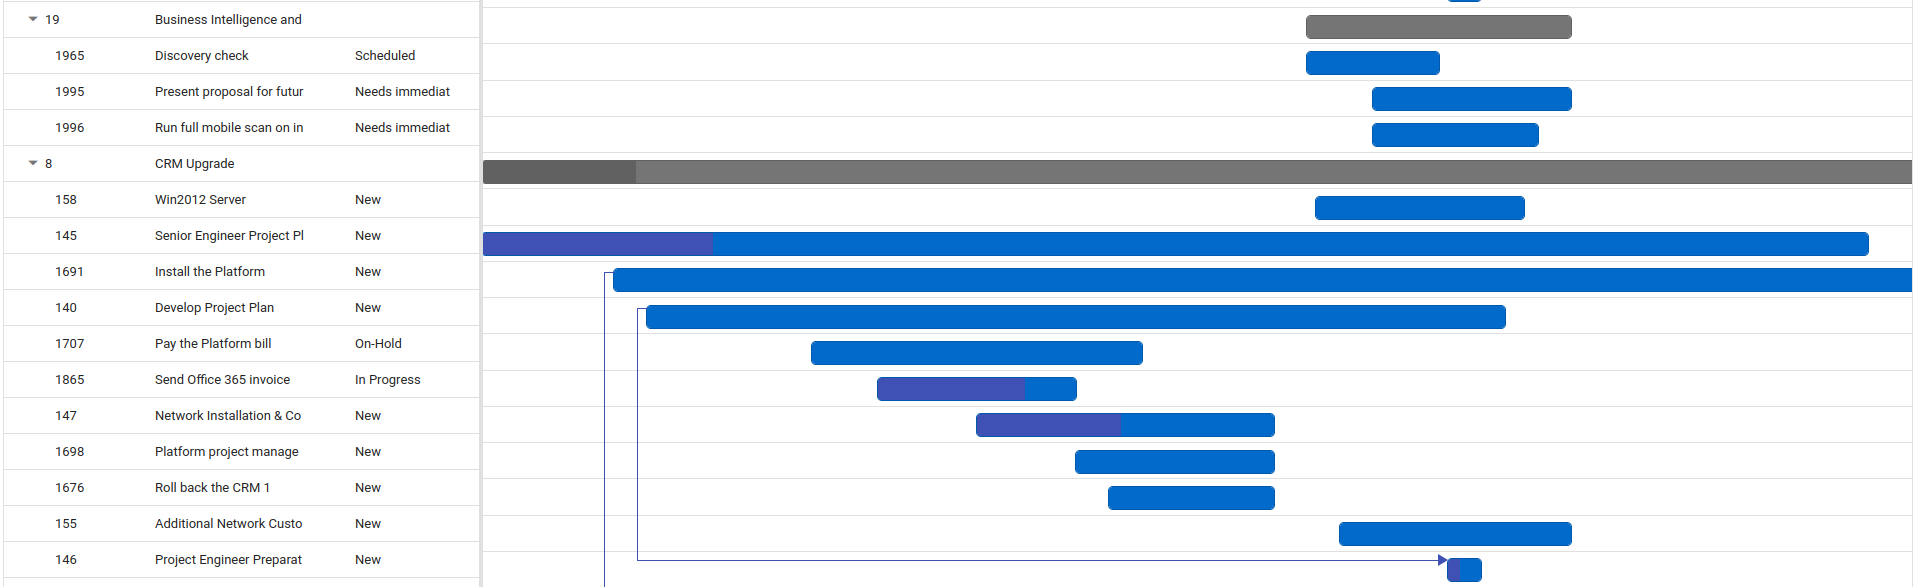
You can use TopLeft Gantt charts to manage the tasks within a single project. Tasks are listed within their phase.
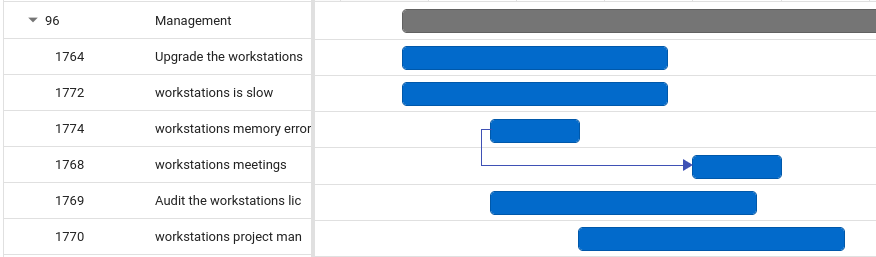
In regards to dependencies, the task predecessors, when set in the PSA, are shown in the Gantt chart. In the above image, task 1774 is the predecessor of task 1768.
You can change the start or end date of a task from the chart:
- To change the task start date, drag the left side of the bar
- To change the task end date, drag the right side of the bar
- To change the start and end date together, drag the body of the bar
How to Access the Gantt Chart
There are two ways to open the Gantt chart for an individual project.
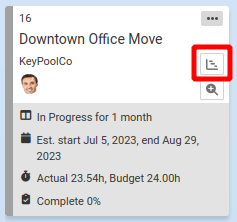
- From a project overview board: on a Kanban board that shows projects, each project card has a link to the project's Gantt chart:
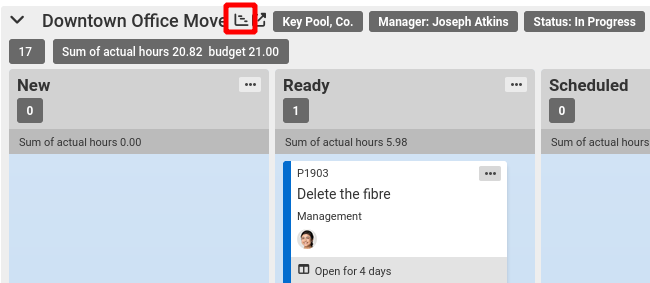
- From a project or phase swimlane board: on a Kanban board that shows tickets or tasks grouped by projects or project phases, the swimlane header includes a link to the project's Gantt chart:
Manage a Project Portfolio in Gantt
You can also use TopLeft Gantt charts to manage your project portfolio.
This view shows only your top-level projects and not their tasks.
You can change the start or end date of a project from the chart by dragging either the left side, left side, or the whole bar.
How to Access the Project Timeline
To open the project timeline, browse to a project board (where cards represent projects), and click the timeline icon in the main menu:

The timeline shows the same projects as are shown on the project Kanban board.
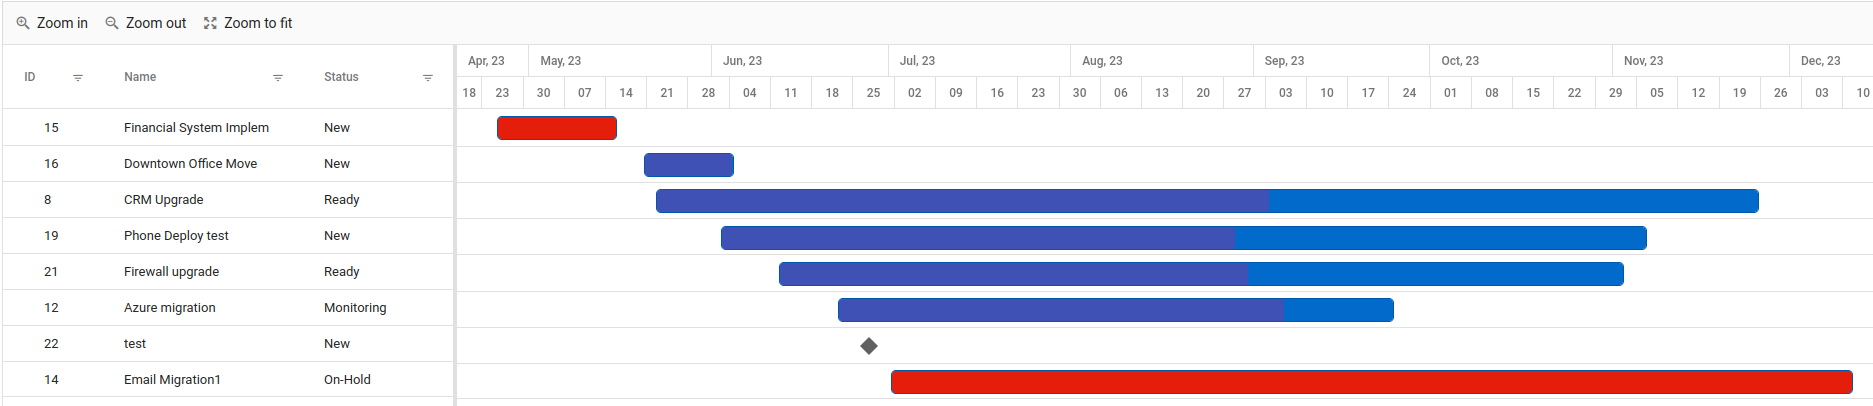
Manage Multiple Projects in Gantt
You can also manage the tasks within multiple projects in Gantt.
This view shows the timing of multiple projects and their tasks. Phases are not shown in this view.
You can change the start or end date of a project or task from the chart by dragging either the left side, left side, or the whole bar.
How to Access the Multiple Gantt Chart
To open this view, browse to a ticket/task board where the swimlane is set to Project or Phase. Then click the timeline icon in the main menu:
The chart shows the same projects and tasks as are shown on the Kanban board.
Monitoring Progress and Budget Overage
TopLeft Gantt charts can help project managers understand their project progress and react quickly to problems.
The colouring of the bar indicates the progress:
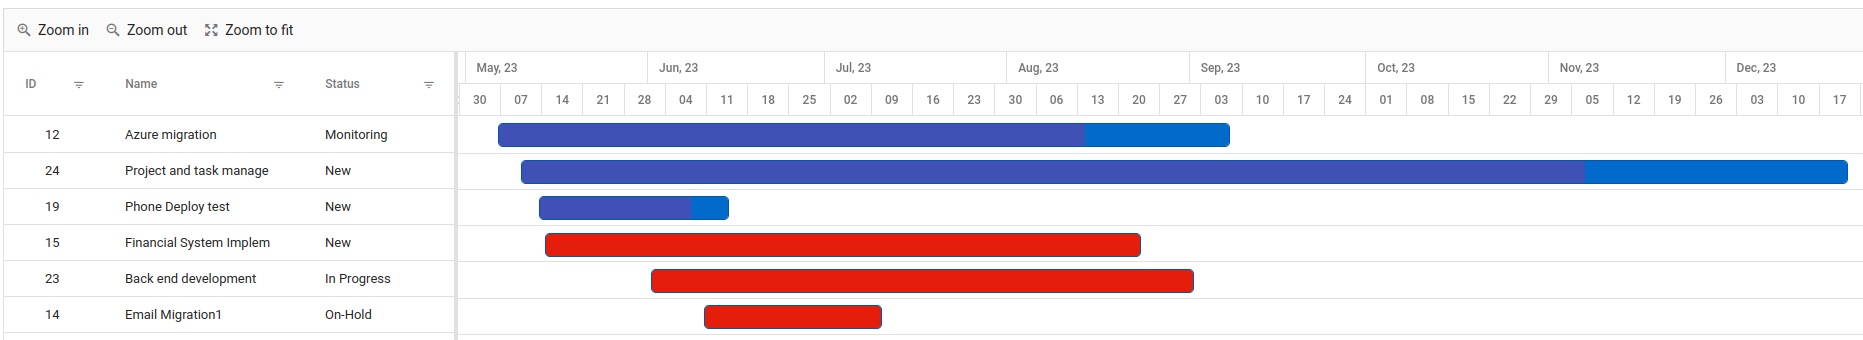
When work exceeds the budget, it is shown in red:
This applies to both tickets, tasks, and projects. If a ticket, task, or project has no budget, no coloring is applied.