![White logo TopLeft_240x78.png]](https://help.topleft.team/hs-fs/hubfs/White%20logo%20TopLeft_240x78.png?height=50&name=White%20logo%20TopLeft_240x78.png)
TopLeft can show data from your PSA on Gantt charts. Gantt charts are a project management tool that shows work based on the scheduled start and end dates of the work.
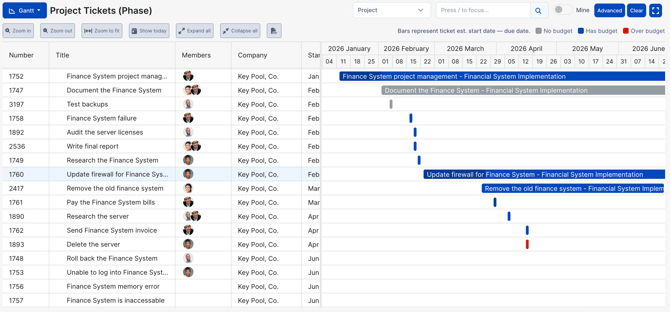
Gantt charts have two parts:
- On the left, a tabular view with columns with various details of the records.
- On the right, a visual taskbar view where a horizontal bar represents the period of time the task is scheduled to be worked.
Gantt charts show predecessor/successor relations between records.
To update general details of a record, click its taskbar to open the editing tool.
Updating Dates
To move a task to a different date, but leave its duration unchanged, drag the taskbar to the left or right.
To change the duration of a task, drag the right side of the taskbar to the left or right.
TopLeft updates the dates of a record in your PSA immediately.
Other Functions
Use the toolbar to exercise other functions:

- Zoom in
- Zoom out
- Zoom to fit: Adjusts the zoom level and position such that no horizontal scrolling is needed to see any records. Keep in mind some records may only become visible when you scroll vertically.
- Show today: turns on a line at the position of today in the taskbar section
- Expand/collapse all
- Export to PDF