![White logo TopLeft_240x78.png]](https://help.topleft.team/hs-fs/hubfs/White%20logo%20TopLeft_240x78.png?height=50&name=White%20logo%20TopLeft_240x78.png)
TopLeft can provide summary information about budgets, logged time, ages, etc. for groups of cards.
It's useful to know certain metrics about groups of cards, not just about single cards. For example:
- For a particular technician's queue of upcoming work, what's the sum of the budget hours?
- For a particular engineer, what's the total logged hours?
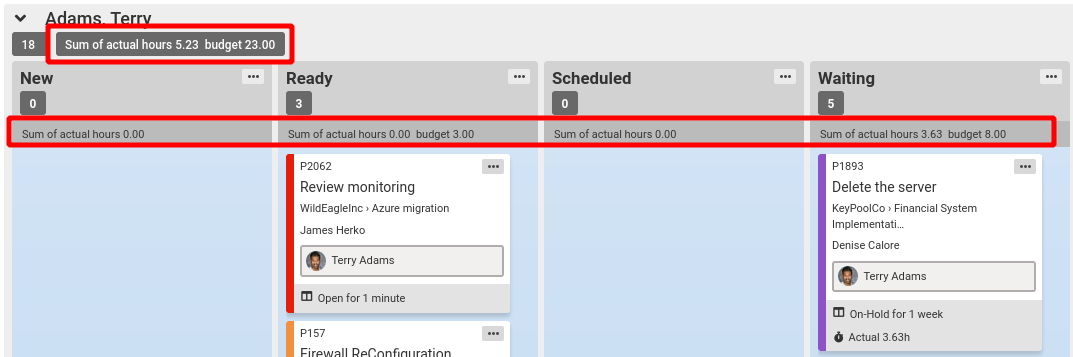
- For a whole team's In Progress work, what's the sum of the logged hours, or what's the average time the tickets have been In Progress?
- For a team's upcoming work, what's the average age of the tickets?
For boards without swimlanes, TopLeft shows metrics for each column. For boards with swimlanes, TopLeft shows metrics for each column, as well as for each swimlane and each column within each swimlane.
Each type of board has different types of metrics that can be shown. To see what can be shown, choose your PSA:
Using Metrics
To show these metrics on your Kanban board, navigate to the board edit page, General tab, and in the Metrics section enable the metrics you want to see.